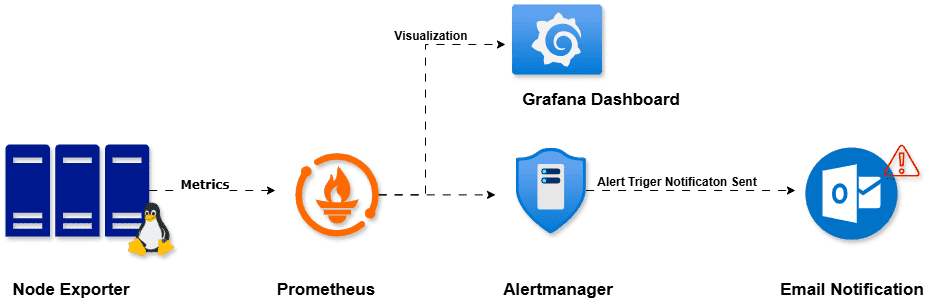
Monitoring your infrastructure with Prometheus is incredibly powerful, but it’s the alerting feature that truly brings operational value to the table. we’ll take you through the steps to install and integrate Alertmanager with Prometheus, as well as how to set up email alerts—like when any node goes down (for instance, when uptime drops below 1)
Prerequisites
Before starting, make sure you have:
- A running Prometheus setup
- Linux system access (root or sudo)
- Internet access (to send emails via SMTP)
- A Gmail account with App Password enabled
👉 Generate an App Password
In this example:
- Alert-manager port:
9093 - Prometheus port:
9090 - Grafana: 3000
- Node-manager: 9100
ALSO READ:
- Sendmail Configuration postfix Install with Gmail SMTP
- Complete 3-Step Guide to Successfully Set Up Prometheus, Node Exporter, and Grafana on Linux Server
- Effortless Way to Automatically Archive Log Files Older Than 30 Days in Linux with Bash Script
Install Alert-manager
Download and extract Alert-manager from the Prometheus downloads page:
cd /opt
wget https://github.com/prometheus/alertmanager/releases/download/v0.29.0-rc.1/alertmanager-0.29.0-rc.1.linux-amd64.tar.gz
tar -xvf alertmanager-0.29.0-rc.1.linux-amd64.tar.gz
mv alertmanager-0.29.0-rc.1.linux-amd64.tar.gz alertmanager
cd alertmanager
You should see files like:
-rwxr-xr-x. 1 prometheus 1002 38948743 Mar  7  2025 alertmanager
-rwxr-xr-x. 1 prometheus 1002 30582387 Mar  7  2025 amtool
-rw-r--r--. 1 prometheus 1002      311 Mar  7  2025 NOTICE
-rw-r--r--. 1 prometheus 1002 11357 Mar 7 2025 LICENSEConfigure alertmanager.yml
Create or edit the configuration file /opt/alertmanager/alertmanager.yml
route:
  group_by: ['alertname']
  group_wait: 30s
  group_interval: 5m
  repeat_interval: 1h
  receiver: 'email'
receivers:
  - name: 'email'
    email_configs:
    - smarthost: 'smtp.gmail.com:587'
      auth_username: 'krishnatummeti@gmail.com'
      auth_password: wleuvisyezouiajl
      from: 'krishnatummeti@gmail.com'
      to: 'krishnatummeti@gmail.com'
      headers:
        subject: "Prometheus service alert"
inhibit_rules:
  - source_match:
      severity: 'critical'
    target_match:
      severity: 'warning'
    equal: ['alertname', 'dev', 'instance']
Note: Use your Gmail App Password, not your actual Gmail password.
Create Systemd Service for Alert-manager
Create a systemd service file to manage Alert-manager as a service.
vi /etc/systemd/system/alertmanager.serviceAdd the following:
[Unit]
Description=alertmanager
Wants=network-online.target
After=network-online.target

[Service]
Type=simple
ExecStart=/opt/alertmanager/alertmanager --config.file /opt/alertmanager/alertmanager.yml
Restart=on-failure

[Install]
WantedBy=multi-user.target
Then start and enable the service:
systemctl daemon-reload
systemctl start alertmanager
systemctl enable alertmanager
systemctl status alertmanagerYou should see Alert-manager running on port 9093.
Test by visiting:
👉 http://localhost:9093
Integrate Alert-manager with Prometheus
Edit Prometheus configuration (/opt/prometheus/prometheus.yml) and add the Alert-manager section
# Alertmanager configuration
alerting:
  alertmanagers:
    - static_configs:
        - targets:
           - "localhost:9093"

# Load rules once and periodically evaluate them according to the global 'evaluation_interval'.
rule_files:
  - "alert_rules/*.yml"
  # - "second_rules.yml"
Create an Alert Rule
Prometheus uses rule files to define conditions for alerts.
Create a rule file under /opt/prometheus/alert_rules/instance_down.yml
groups:
- name: instance_down
  labels:
    team: L2-Team
  rules:
  - alert: instance-Down-Alert
    expr: up < 1
    for: 1m
    keep_firing_for: 5m
    labels:
      severity: critical
    annotations:
      summary: instance is down
Restart Prometheus
systemctl restart prometheus
systemctl status prometheusTest the Alert
- Stop one of your Node Exporter instances or any monitored target.
- Wait for about 1 minute (as defined by for: 1m).
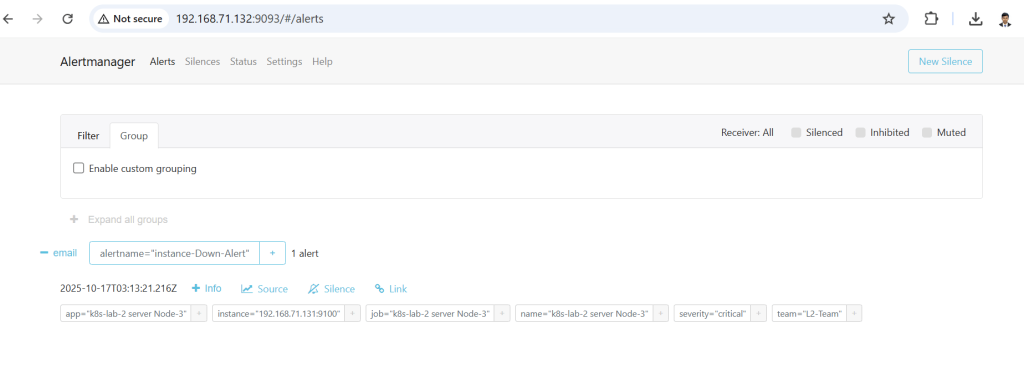
- Check the Alerts page in Prometheus:
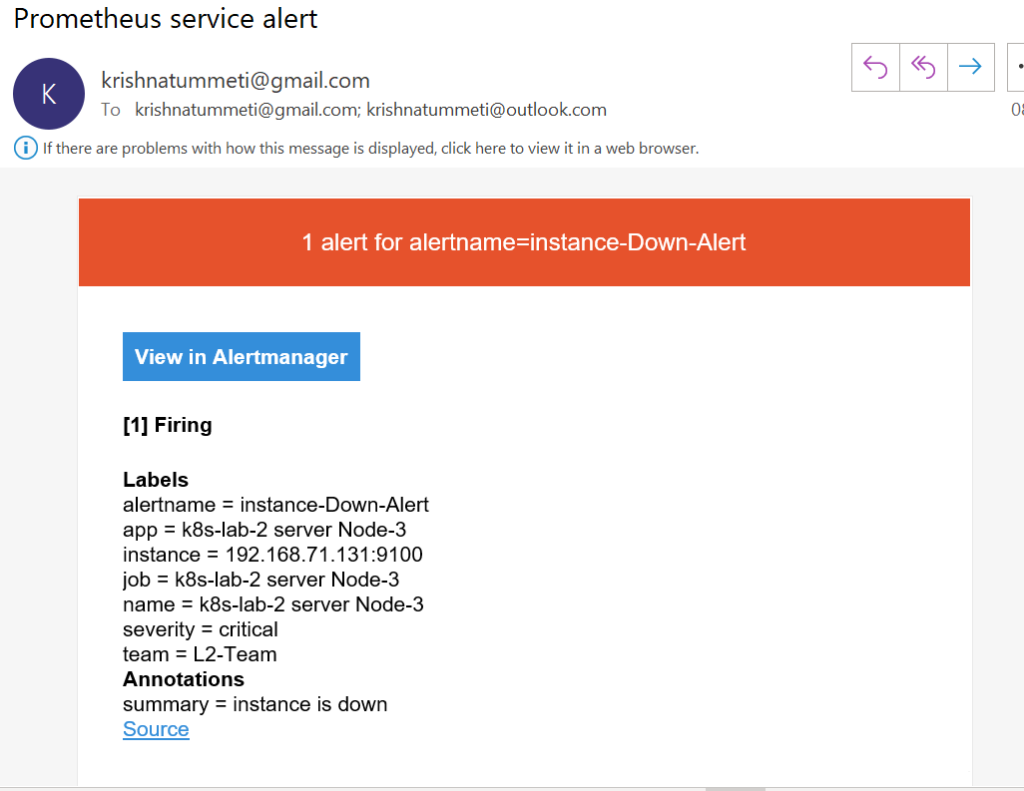
http://localhost:9090/alerts - You’ll also receive an email alert from Alert-manager like:
Troubleshooting
| Issue | Possible Cause | Solution |
|---|---|---|
| No email received | Gmail blocked connection | Use App Passwords and port 587 |
| Alert not firing | Rule syntax or up < 1 not matching | Check /targets in Prometheus UI |
| Prometheus can’t reach Alert-manager | Wrong port or IP | Ensure localhost:9093 is accessible |