Introduction
System monitoring is essential for maintaining performance, availability, and reliability in production environments. An effective prometheus monitoring stack provides real-time insights, resource utilization metrics, and alerting capabilities.
- Prometheus – the monitoring system that stores and queries metrics
- Node Exporter – the agent that collects system-level statistics from Linux servers
- Grafana – the visualization tool that turns raw metrics into interactive dashboards
By the end of this setup, you will have collecting metrics from Node Exporter and Grafana visualizing those metrics in customizable dashboards.
Prerequisites
Before we dive in, make sure you have:
- A Rocky Linux server (or RHEL/CentOS)
- Sudo or root access
- Basic Linux command knowledge
Open ports on your firewall:
- 9090 → Prometheus
- 9100 → Node Exporter
- 3000 → Grafana
ALSO READ:
- Easily Automatically Delete Linux Log Files Older Than 30 Days Using a Bash Script
- Effortless Way to Automatically Archive Log Files Older Than 30 Days in Linux with Bash Script
- 1 Powerful Shell Script to Monitor Missing Mount Points in Linux
Click here to go to the GitHub repos link
Step 1: Setting Up Prometheus
# Go to /opt
cd /opt

# Download Prometheus (replace with latest version)
wget https://github.com/prometheus/prometheus/releases/download/v3.6.0/prometheus-3.6.0.linux-amd64.tar.gz

# Extract
tar -xvf prometheus-3.6.0.linux-amd64.tar.gz
mv prometheus-3.6.0.linux-amd64 prometheus
Create Prometheus YAML Configuration file (below location)
(/opt/prometheus/prometheus.yml)
# my global config
global:
  scrape_interval: 15s # Set the scrape interval to every 15 seconds. Default is every 1 minute.
  evaluation_interval: 15s # Evaluate rules every 15 seconds. The default is every 1 minute.
alerting:
  alertmanagers:
    - static_configs:
        - targets:
          # - alertmanager:9093

# Load rules once and periodically evaluate them according to the global 'evaluation_interval'.
rule_files:
  # - "first_rules.yml"
  # - "second_rules.yml"

# A scrape configuration containing exactly one endpoint to scrape:
# Here it's Prometheus itself.
scrape_configs:
  # The job name is added as a label `job=<job_name>` to any timeseries scraped from this config.
  - job_name: "prometheus"

    # metrics_path defaults to '/metrics'
    # scheme defaults to 'http'.

    static_configs:
      - targets: ["localhost:9090"]
       # The label name is added as a label `label_name=<label_value>` to any timeseries scraped from this config.
        labels:
          app: "prometheus"
          name: "prometheus"

          # Change your target server name and iP address

  - job_name: "Jenkins server Node-1"

    static_configs:
      - targets: ["192.168.71.128:9100"]
        labels:
          app: "Jenkins server Node-1"
          name: "Jenkins server Node-1"
Create Service File Configuration file (below location)
[Unit]
Description=Prometheus
Wants=network-online.target
After=network-online.target

[Service]
Type=simple
ExecStart=/opt/prometheus/prometheus --config.file /opt/prometheus/prometheus.yml
Restart=on-failure

[Install]
WantedBy=multi-user.targetStart Prometheus
systemctl daemon-reload
systemctl enable prometheus
systemctl start prometheus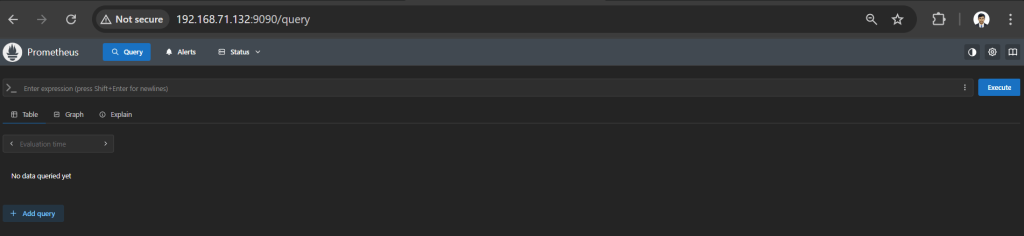
systemctl status prometheusOpen your browser and check:
http://your-server-ip:9090
Step 2: Installing Node Exporter
Prometheus collects data, but it needs a source to get that data from your system. Node Exporter does that job. It collects basic information from your Linux server like CPU, memory, disk, and network usage and sends it to Prometheus.
Download Node Exporter
cd /opt
wget https://github.com/prometheus/node_exporter/releases/download/v1.9.1/node_exporter-1.9.1.linux-amd64.tar.gz
tar -xvf node_exporter-1.9.1.linux-amd64.tar.gz
mv node_exporter-1.9.1.linux-amd64 node_exporterCreate Service File (below location)
(/etc/systemd/system/node_exporter.service)
[Unit]
Description=Node Exporter agent
Wants=network-online.target
After=network-online.target

[Service]
Type=simple
ExecStart=/opt/node_exporter/node_exporter
Restart=on-failure

[Install]
WantedBy=multi-user.targetStart Node Exporter
systemctl daemon-reload
systemctl enable node_exporter
systemctl start node_exporter
systemctl status node_exporter
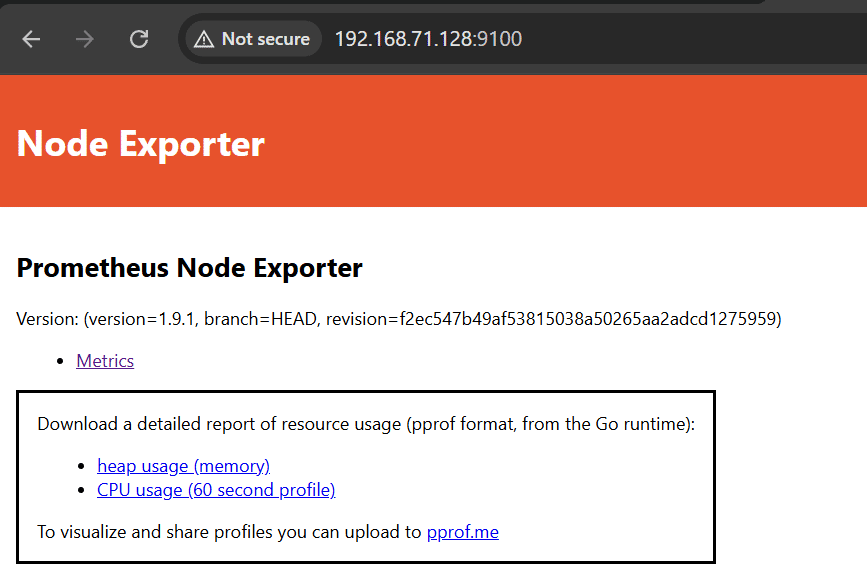
Open your browser and Metrics available at:
http://:9100/metrics
Step 3: Installing Grafana
visualizing everything in dashboards.
Add Grafana Repo
[grafana]
name=grafana
baseurl=https://rpm.grafana.com
repo_gpgcheck=1
enabled=1
gpgcheck=1
gpgkey=https://rpm.grafana.com/gpg.key
sslverify=1
sslcacert=/etc/pki/tls/certs/ca-bundle.crtInstall and start Grafana
dnf install grafana -y
systemctl enable grafana-server
systemctl start grafana-server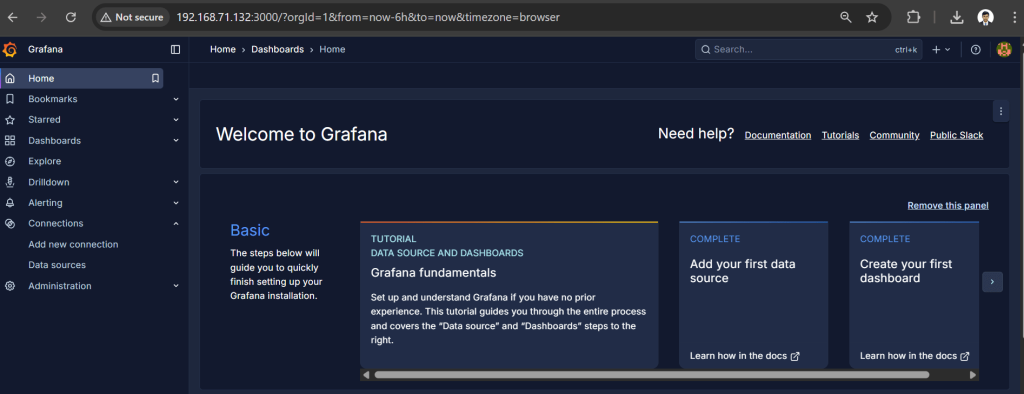
systemctl status grafana-serverOpen your browser:http://<your-server-ip>:3000
(Default login: admin / admin) → You’ll be asked to change the password.
We have successfully installed and configured:
- Prometheus (for monitoring & data collection)
- Node Exporter (for Linux server metrics)
- Grafana (for dashboards and visualization)
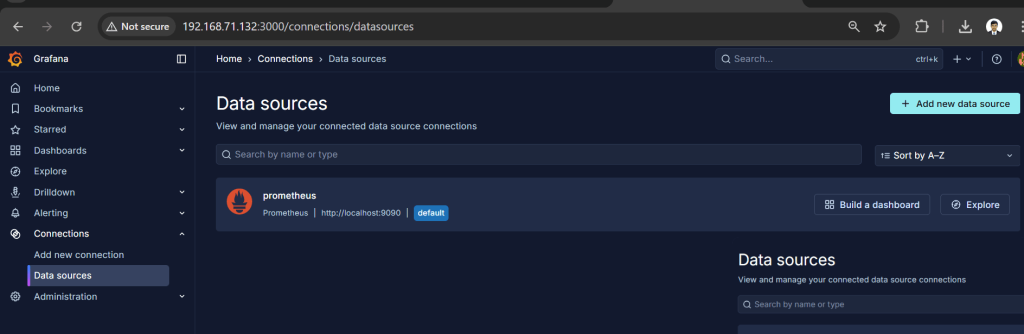
Now you can log into Grafana, add Prometheus as a data source, and start importing community dashboards for Linux monitoring.