Introduction
This project is a simple Bash-based Linux Health Checks monitoring script.
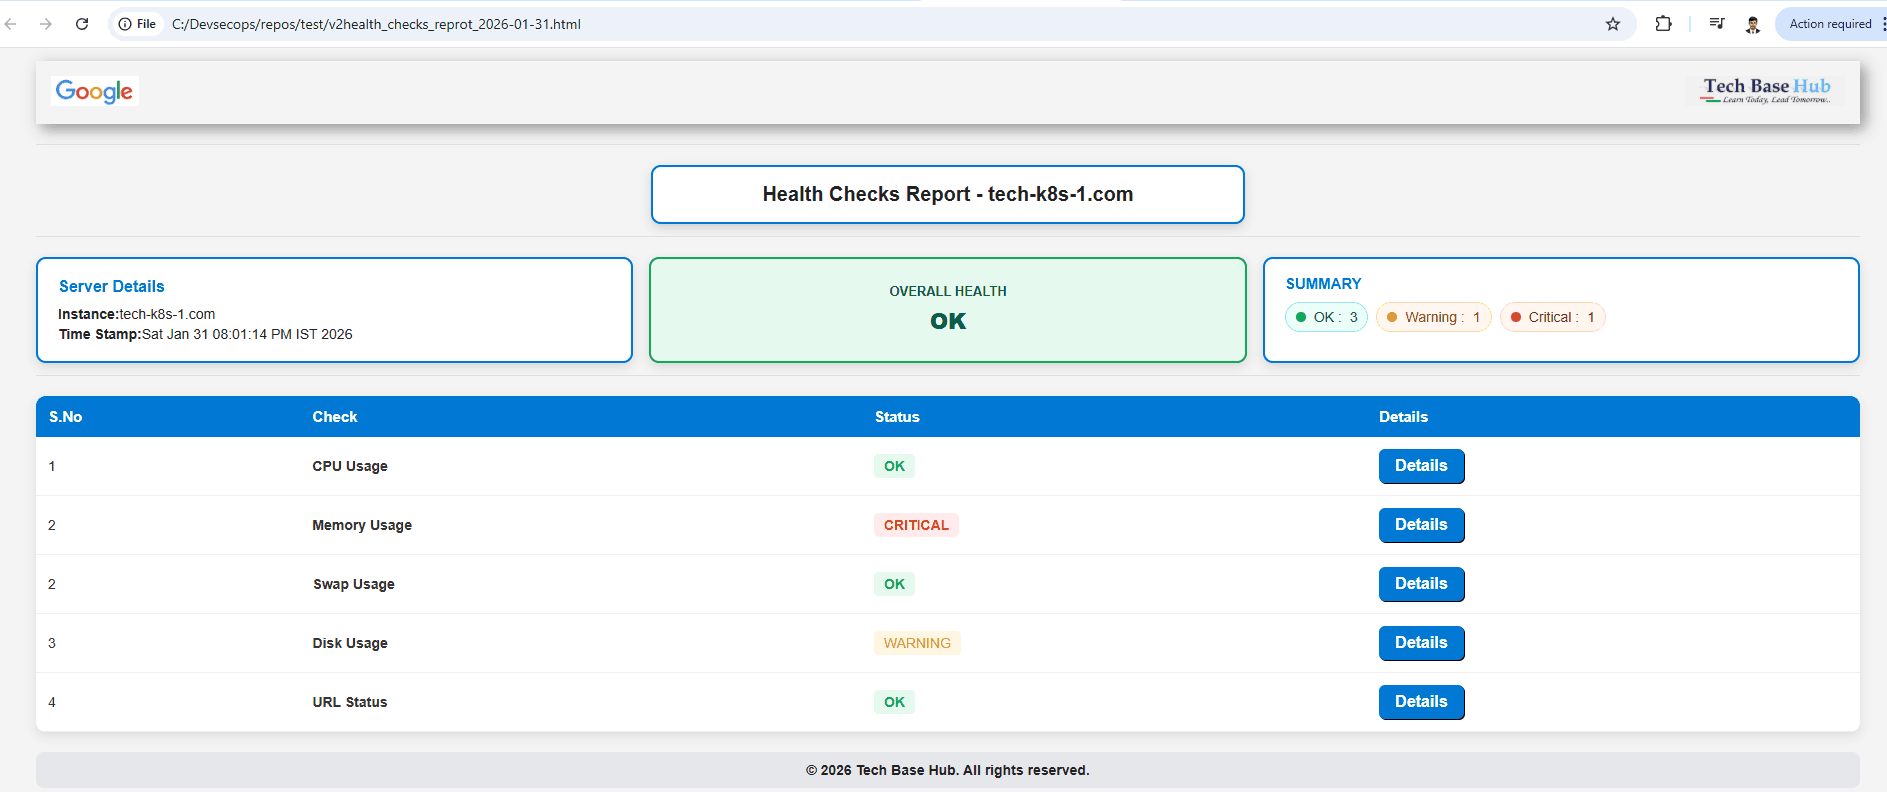
It collects server metrics such as CPU, memory, disk, swap, and URL status, then generates an HTML dashboard report indicating whether the system is OK, Warning, or Critical.
Prerequisites
- Linux system (Ubuntu/CentOS/RHEL)
- Basic Bash scripting knowledge
- Commands:
top,free,df,curl,awk - Web browser to view the HTML report
ALSO READ:
- Complete Install Kubernetes with Kind (Kubernetes IN Docker) on RHEL 9 / CentOS Stream 9
- AWS S3 Backups with This Efficient Shell Script
- Bash Brackets Explained in Simple Words (With 8 Examples)
Click here to go to the GitHub repos link
Features
- CPU usage check
- Memory usage check
- Swap usage check
- Disk utilization check
- URL/website status check
- Automatic status classification (OK / Warning / Critical)
- Interactive HTML dashboard with filters and details
- Can be scheduled using cron
Health Checks Work:
- Collects system data using Linux commands
- Compares values with thresholds
- Assigns health status
- Generates a styled HTML report
Health Check Shell Script
#!/bin/bash

# Output folder and file
REPORT_DIR="/home/devuser/techbasehub_scripts/health_cecks_script"
mkdir -p "$REPORT_DIR"

DATE_STAMP=$(date +'%Y-%m-%d')
REPORT_FILE="$REPORT_DIR/health_report_$DATE_STAMP.html"

echo "Generating report: $REPORT_FILE"

# ─────────────── CALCULATE ALL CHECKS ───────────────


# Memory
mem_used_percent=$(free | awk '/Mem:/ {printf "%.0f", ($3*100/$2)}')
if [ "$mem_used_percent" -ge 70 ]; then
    mem_status_class="status-critical"
    mem_status_text="CRITICAL"
    mem_status_data="critical"
elif [ "$mem_used_percent" -ge 40 ]; then
    mem_status_class="status-warning"
    mem_status_text="WARNING"
    mem_status_data="warning"
else
    mem_status_class="status-ok"
    mem_status_text="OK"
    mem_status_data="ok"
fi
mem_details=$(free -h | awk 'NR==2 {print "<tr><th>Mem:</th><td>"$2"</td><td>"$3"</td><td>"$4"</td><td>"$5"</td><td>"$6"</td><td>"$7"</td></tr>"}')

# Swap
swap_used_percent=$(free | awk '/Swap:/ {if ($2==0) print 0; else printf "%.0f", ($3*100/$2)}')
if [ "$swap_used_percent" -ge 30 ]; then
    swap_status_class="status-critical"
    swap_status_text="CRITICAL"
    swap_status_data="critical"
elif [ "$swap_used_percent" -ge 10 ]; then
    swap_status_class="status-warning"
    swap_status_text="WARNING"
    swap_status_data="warning"
else
    swap_status_class="status-ok"
    swap_status_text="OK"
    swap_status_data="ok"
fi
swap_details=$(free -h | awk 'NR==3 {print "<tr><th>Swap:</th><td>"$2"</td><td>"$3"</td><td>"$4"</td></tr>"}')

# ─────────────── Disk ───────────────

# First — keep your overall disk status logic (you can adjust thresholds later)
disk_critical_count=$(df -h | awk 'NR>1 && $5+0 >= 90 {print}' | wc -l)
disk_high_count=$(df -h | awk 'NR>1 && $5+0 >= 30 && $5+0 < 90 {print}' | wc -l)

if [ "$disk_critical_count" -gt 0 ]; then
    disk_status_class="status-critical"
    disk_status_text="CRITICAL"
    disk_status_data="critical"
elif [ "$disk_high_count" -gt 0 ]; then
    disk_status_class="status-warning"
    disk_status_text="WARNING"
    disk_status_data="warning"
else
    disk_status_class="status-ok"
    disk_status_text="OK"
    disk_status_data="ok"
fi

# Now — improved details with per-row highlighting
disk_details=$(df -Th | awk 'NR>1 {
    # IMPORTANT: Use% is column $6, not $5
    usep_str = $6;
    gsub(/%/, "", usep_str);          # remove % sign
    usep = usep_str + 0;              # force numeric

    color = "";
    if (usep >= 30) {
        color = "background:#FEE2E2; color:#991B1B; font-weight:bold;";
    } else if (usep >= 75) {
        color = "background:#FEF3C7; color:#92400E; font-weight:bold;";
    } else if (usep >= 30) {
        color = "background:#FEF9C3; color:#854D0E;";
    }

    printf "<tr style=\"%s\"><td>%s</td><td>%s</td><td>%s</td><td>%s</td><td>%s</td><td>%s</td><td>%s</td></tr>\n",
        color, $1, $2, $3, $4, $5, $6, $7
}')

# URL
url_status_code=$(curl -s -o /dev/null -w "%{http_code}" https://www.google.com 2>/dev/null || echo "000")
if [ "$url_status_code" = "200" ]; then
    url_status_class="status-ok"
    url_status_text="OK"
    url_status_data="ok"
else
    url_status_class="status-critical"
    url_status_text="CRITICAL"
    url_status_data="critical"
fi
url_details=$(curl -sI https://www.google.com 2>/dev/null || echo "Failed to fetch headers")

# ─────────────── CALCULATE COUNTS ───────────────
ok_count=0
warning_count=0
critical_count=0

cpu_usage=$(top -bn1 | grep -m1 '%Cpu' | awk '{print int($2 + $4)}')
if [ "$cpu_usage" -le 10 ]; then
    cpu_status_class="status-ok"
    cpu_status_text="OK"
    cpu_status_data="ok"
elif [ "$cpu_usage" -le 70 ]; then
    cpu_status_class="status-warning"
    cpu_status_text="WARNING"
    cpu_status_data="warning"
else
    cpu_status_class="status-critical"
    cpu_status_text="CRITICAL"
    cpu_status_data="critical"
fi
cpu_details=$(top -bn1 | grep -m1 '%Cpu' | awk '{printf "<tr><td>%s</td><td>%s</td><td>%s</td><td>%s</td></tr>", $2, $4, $6, $8}')


[ "$cpu_status_data" = "ok" ] && ok_count=$((ok_count + 1))
[ "$cpu_status_data" = "warning" ] && warning_count=$((warning_count + 1))
[ "$cpu_status_data" = "critical" ] && critical_count=$((critical_count + 1))

[ "$mem_status_data" = "ok" ] && ok_count=$((ok_count + 1))
[ "$mem_status_data" = "warning" ] && warning_count=$((warning_count + 1))
[ "$mem_status_data" = "critical" ] && critical_count=$((critical_count + 1))

[ "$swap_status_data" = "ok" ] && ok_count=$((ok_count + 1))
[ "$swap_status_data" = "warning" ] && warning_count=$((warning_count + 1))
[ "$swap_status_data" = "critical" ] && critical_count=$((critical_count + 1))

[ "$disk_status_data" = "ok" ] && ok_count=$((ok_count + 1))
[ "$disk_status_data" = "warning" ] && warning_count=$((warning_count + 1))
[ "$disk_status_data" = "critical" ] && critical_count=$((critical_count + 1))

[ "$url_status_data" = "ok" ] && ok_count=$((ok_count + 1))
[ "$url_status_data" = "warning" ] && warning_count=$((warning_count + 1))
[ "$url_status_data" = "critical" ] && critical_count=$((critical_count + 1))

# ─────────────── OVERALL HEALTH ───────────────
if [ "$critical_count" -gt 0 ]; then
    overall_class="critical"
    overall_text="CRITICAL"
elif [ "$warning_count" -gt 0 ]; then
    overall_class="warning"
    overall_text="WARNING"
else
    overall_class="ok"
    overall_text="OK"
fi

# ─────────────── START HTML ───────────────
cat > "$REPORT_FILE" << EOF
<!DOCTYPE html>
<html>
<head>
  <meta charset="utf-8" />
  <title>Health Checks Report - $(hostname)</title>
  <style>
    body {
      font-family: Arial, sans-serif;
      padding: 30px;
      padding-top: 5px;
      background-color: #F4F4F4;
      color: #222;
      max-width: 1400px;
      margin: 0 auto;
    }

    hr {
      border: none;
      border-top: 1px solid #E0E0E0;
      margin: 12px 0 20px;
    }

    .box {
      width: 550px;
      margin: 0 auto;
      padding: 16px 20px;
      border: 2px solid #0078D4;
      border-radius: 10px;
      text-align: center;
      font-size: 20px;
      font-weight: bold;
      background: #FFFFFF;
      box-shadow: 0 4px 10px rgba(0,0,0,0.15);
    }

    .row3 {
      display: flex;
      gap: 16px;
      align-items: stretch;
      width: 100%;
    }

    .instance-box,
    .status-box,
    .summary-box {
      flex: 1;
      min-width: 250px;
      border-radius: 10px;
      box-shadow: 0 4px 10px rgba(0,0,0,0.12);
      padding: 16px 20px;
    }

    .instance-box {
      border: 2px solid #0078D4;
      background: #FFFFFF;
    }

    .instance-box .meta {
      font-size: 14px;
      line-height: 1.45;
    }

    .server-heading {
      font-size: 16px;
      font-weight: bold;
      margin-bottom: 6px;
      color: #0078D4;
    }

    .status-box {
      font-weight: 600;
      text-align: center;
      display: flex;
      flex-direction: column;
      justify-content: center;
      align-items: center;
    }

    .status-box .label {
      font-size: 13px;
      text-transform: uppercase;
      margin-bottom: 6px;
    }

    .status-box .value {
      font-size: 22px;
      font-weight: 800;
    }

    .status-box.ok { border-color: #0FA958; background: #E6F9EE; color: #065F46; }
    .status-box.warning { border-color: #F59E0B; background: #FFF7ED; color: #9A3412; }
    .status-box.critical { border-color: #D62828; background: #FEECEC; color: #7F1D1D; }

    .summary-box {
      border: 2px solid #0078D4;
      background: #FFFFFF;
      color: #222;
      font-weight: 600;
    }

    .summary-box .label {
      display: block;
      font-size: 15px;
      text-transform: uppercase;
      margin-bottom: 10px;
      color: #0078D4;
    }

    .summary-actions {
      display: flex;
      gap: 12px;
      flex-wrap: wrap;
      justify-content: center;
    }

    .summary-indicator {
      display: inline-flex;
      align-items: center;
      gap: 8px;
      padding: 6px 14px;
      font-size: 14px;
      border-radius: 999px;
      font-weight: 500;
      pointer-events: none;
      cursor: default;
    }

    .summary-indicator .dot {
      width: 10px; height: 10px; border-radius: 50%; display: inline-block;
    }

    .summary-indicator.ok { color: #065F46; background: #ECFDF5; border: 1px solid #A7F3D0; }
    .summary-indicator.warning { color: #92400E; background: #FFF7ED; border: 1px solid #FED7AA; }
    .summary-indicator.critical { color: #7F1D1D; background: #FEF2F2; border: 1px solid #FECACA; }

    .health-table {
      width: 100%;
      max-width: 100%;
      table-layout: fixed;
      border-collapse: collapse;
      margin-top: 20px;
      background: #fff;
      border-radius: 10px;
      box-shadow: 0 4px 10px rgba(0,0,0,0.1);
    }

    .health-table th,
    .health-table td {
      word-break: break-word;
      overflow-wrap: break-word;
      white-space: normal;
      padding: 10px;
      font-size: 13px;
      border-bottom: 1px solid #EEE;
      vertical-align: top;
    }

    .health-table th {
      background: #0078D4;
      color: white;
      text-align: left;
    }

    .status-ok { color: #0FA958; background: #E6F9EE; padding: 4px 10px; border-radius: 5px; font-weight: bold; }
    .status-warning { color: #E29A00; background: #FFF4E0; padding: 4px 10px; border-radius: 5px; font-weight: bold; }
    .status-critical { color: #D62828; background: #FEECEC; padding: 4px 10px; border-radius: 5px; font-weight: bold; }


.data-row td {
    padding: 16px 12px;
    background: #e2e8f0 !important;     /* stronger light gray */
    border-radius: 10px 10px 0 0;
    border-bottom: none !important;
    font-weight: 700 !important;        /* bolder text */
    color: #1e293b !important;          /* darker text */
}

.data-row {
    background: transparent !important;
    margin-bottom: 0 !important;
}

.data-row td {
    padding: 16px 12px;
    background: #f1f5f9;
    border-radius: 8px 8px 0 0;
    border-bottom: none !important;
    font-weight: 600;
}

.health-table tr:not(.data-row) td {
    background: transparent !important;
    padding-top: 0 !important;
}

    .details-content pre {
      white-space: pre-wrap;
      word-break: break-word;
      overflow-wrap: break-word;
      font-size: 12px;
      line-height: 1.4;
      background: #f8f9fa;
      padding: 10px;
      border-radius: 6px;
      border: 1px solid #ddd;
    }

    .inner-table {
      width: 100%;
      border-collapse: collapse;
      margin-top: 8px;
      background: #fff;
      border: 1px solid #EEE;
      border-radius: 8px;
      overflow: hidden;
    }

    .inner-table th {
      background: #F3F4F6;
      padding: 8px 10px;
      text-align: left;
      font-size: 13px;
      color: #111827;
    }

    .inner-table td {
      padding: 8px 10px;
      border-top: 1px solid #F1F1F1;
      color: #333;
    }

    .top-header {
      padding: 15px;
      display: flex;
      justify-content: space-between;
      margin-bottom: 20px;
      box-shadow: 5px 5px 15px rgba(0, 0, 0, 0.4);
    }

    .top-header img:hover { transform: scale(1.05); }

    .footer-bar {
      background: #E5E7EB;
      padding: 10px;
      text-align: center;
      border-radius: 8px;
      margin-top: 20px;
      font-size: 14px;
      font-weight: bold;
    }
  </style>
</head>
<body>

<div class="top-header">
  <!-- CHANGE THESE TO REAL PATHS OR URLs -->
  <div><img src="/images/google.png" alt="Google Logo" height="30"></div>
  <div><img src="/images/tech_base_hub.png" alt="Tech Base Hub Logo" height="30"></div>
</div>

<hr>

<div class="box">
  Health Checks Report - $(hostname)
</div>

<hr>

<div class="row3">
  <div class="instance-box">
    <div class="meta">
      <div class="server-heading">Server Details</div>
      <div><b>Instance:</b> $(hostname)</div>
      <div><b>Time Stamp:</b> $(date '+%a %b %d %I:%M:%S %p %Z %Y')</div>
    </div>
  </div>

  <div class="status-box $overall_class">
    <span class="label">Overall Health</span>
    <span class="value">$overall_text</span>
  </div>

  <div class="summary-box">
    <span class="label">Summary</span>
    <div class="summary-actions">
      <div class="summary-indicator ok">
        <span class="dot" style="background:#0FA958"></span>
        OK : $ok_count
      </div>
      <div class="summary-indicator warning">
        <span class="dot" style="background:#E29A00"></span>
        Warning : $warning_count
      </div>
      <div class="summary-indicator critical">
        <span class="dot" style="background:#D62828"></span>
        Critical : $critical_count
      </div>
    </div>
  </div>
</div>

<hr>

<table class="health-table" id="healthTable">
  <tr>
    <th>S.No</th>
    <th>Check</th>
    <th>Status</th>
  </tr>
EOF

# ─────────────── PRINT TABLE ROWS ───────────────


# CPU row


cat >> "$REPORT_FILE" << EOF
  <tr class="data-row" data-status="$cpu_status_data">
    <td>1</td>
    <td><b>CPU Usage</b></td>
    <td><span class="$cpu_status_class">$cpu_status_text</span></td>
  </tr>
  <tr>
    <td colspan="3" class="details-content">
      <h4><u>CPU Usage</u></h4>
      <table class="inner-table">
        <tr><th>Processor %</th><th>User %</th><th>System %</th><th>Idle %</th></tr>
        $cpu_details
      </table>
    </td>
  </tr>
EOF

# Memory row
cat >> "$REPORT_FILE" << EOF
  <tr class="data-row" data-status="$mem_status_data">
    <td>2</td>
    <td><b>Memory Usage</b></td>
    <td><span class="$mem_status_class">$mem_status_text</span></td>
  </tr>
  <tr>
    <td colspan="3" class="details-content">
      <h4><u>Memory Usage</u></h4>
      <table class="inner-table">
        <tr><th></th><th>Total</th><th>Used</th><th>Free</th><th>Shared</th><th>Buff/Cache</th><th>Available</th></tr>
        $mem_details
      </table>
    </td>
  </tr>
EOF

# Swap row
cat >> "$REPORT_FILE" << EOF
  <tr class="data-row" data-status="$swap_status_data">
    <td>3</td>
    <td><b>Swap Usage</b></td>
    <td><span class="$swap_status_class">$swap_status_text</span></td>
  </tr>
  <tr>
    <td colspan="3" class="details-content">
      <h4><u>Swap Usage</u></h4>
      <table class="inner-table">
        <tr><th></th><th>Total</th><th>Used</th><th>Free</th></tr>
        $swap_details
      </table>
    </td>
  </tr>
EOF

# Disk row
cat >> "$REPORT_FILE" << EOF
  <tr class="data-row" data-status="$disk_status_data">
    <td>4</td>
    <td><b>Disk Usage</b></td>
    <td><span class="$disk_status_class">$disk_status_text</span></td>
  </tr>
  <tr>
    <td colspan="3" class="details-content">
      <h4><u>Disk Usage</u></h4>
      <table class="inner-table">
        <tr><th>Filesystem</th><th>Type</th><th>Size</th><th>Used</th><th>Avail</th><th>Use%</th><th>Mounted on</th></tr>
        $disk_details
      </table>
    </td>
  </tr>
EOF

# URL row
cat >> "$REPORT_FILE" << EOF
  <tr class="data-row" data-status="$url_status_data">
    <td>5</td>
    <td><b>URL Status</b></td>
    <td><span class="$url_status_class">$url_status_text</span></td>
  </tr>
  <tr>
    <td colspan="3" class="details-content">
      <h4><u>URL Status</u></h4>
      <table class="inner-table">
        <tr><td><pre>$url_details</pre></td></tr>
      </table>
    </td>
  </tr>
EOF

# ─────────────── CLOSE HTML ───────────────
cat >> "$REPORT_FILE" << EOF
</table>

<footer class="footer-bar">
  © 2026 Tech Base Hub. All rights reserved.
</footer>

</body>
</html>
EOF

echo "Report generated successfully!"
echo "File: $REPORT_FILE"
echo "You can download it via WinSCP from: $REPORT_FILE"
echo "Open in browser: file://$REPORT_FILE"Note: Please update thresholds, paths, and URLs as per your server environment before running the script.
